History Overview: Since the Bicycle Master Plan was adopted in 2013, both Utah Street and 30th Street have been listed as high-demand north-south bike corridors in North Park. Although the Bicycle Master Plan lists 30th Street at a lower bicycle lane classification (sharrows or unprotected bike lane), it was written before Caltrans had recognized protected bicycle facilities, limiting the city’s ability to add them to its network. By the time of the North Park Community Plan update in 2016, the need for an expanded bicycle network in our urban areas become more important in light of the Climate Action Plan’s goal of increasing the percent of commuters traveling by bike from 2 percent to 18 percent. The updated North Park Community Plan recommended that every street in North Park be designed as a “complete street,” meaning it is safe and convenient for all road users of all ages and abilities. To achieve this goal, the Plan includes policies to repurpose the existing right-of-way, largely dedicated to car travel and on-street parking, to improve walkability and the ability to bike by building wider, protected bikeways “where feasible.” These goals echo the General Plan’s Mobility Element, which includes policies to upgrade streets to enhance existing bicycle facilities to commercial districts where feasible and fundable. As other policies explain, the most cost-effective (e.g., fundable) method to achieve these goals is to combine bicycle improvements with street resurfacing. Following the City’s admissions that the existing bicycle facilities were insufficient to meet the Climate Action Plan mode share goals, the City committed to adding additional bicycle facilities “whenever street resurfacing occurs, as feasible.”
December 2013: Bicycle Master Plan <https://www.sandiego.gov/sites/default/files/legacy/planning/programs/transportation/mobility/pdf/bicycle_master_plan_final_dec_2013.pdf>
Recognizes that the existing bike network “has limited facilities that cater to less experienced cyclists. Attracting new cyclists requires developing an interconnected network that provides bicycle access within and between neighborhoods and that meets the needs of all cyclists.” (p. 8.)
Notes that Community Plan Updates preempt the Bicycle Master Plan: “Where community plans provide site specific guidance related to bikeway paths and facilities, the community plan takes precedence. In cases where site specific guidance is absent in a community plan, the Bike Master Plan will take precedence so long as proposed improvements are not inconsistent with the goals and policies of the community plan. ” (p. 48.)
Includes bicycle demand analysis to identify “roadway segments with the greatest propensity for bicycling activity.” (p. 77.) Identifies both Utah AND 30th Street as highest demand north-south corridors in North Park. (p. 78.)
Identifies key network, but notes that “proposed classifications are expected to be used as a guide and may change and implementation. The City of San Diego will strive to construct Class I facilities when possible.” (p. 94.)
Includes Utah Street AND 30th Street north of Upas as Class II or III north-south bike routes. (p. 98.)
Mentions cycle tracks (protected bike way) but notes that “cycle tracks are not recognized by Caltrans Highway Design Manual as a bikeway facility.” (p. 22.)
June 2015: Mobility Element of General Plan <https://www.sandiego.gov/sites/default/files/me_2015.pdf>
Policy ME-F.2: Identify and implement a network of bikeways that are feasible, fundable, and serve bicyclists’ needs, especially for travel to employment centers, village centers, schools, commercial districts, transit stations and institutions.” (p. ME-40.) Also includes direction to “upgrade existing roadways to enhance bicycle travel, where feasible.”
Policy ME-G.3(c): “Judiciously limit or prohibit on street parking where needed to improve safety, or to implement multi-modal facilities such as bikeways, transit ways, and parkways.” (p. ME-44.)
December 2015: San Diego Climate Action Plan: https://www.sandiego.gov/sites/default/files/final_july_2016_cap.pdf
Identifies strategy of reducing greenhouse gas emissions by achieving target of six percent bicycle mode share by 2020 and 18 percent bicycle mode share by 2035 in Transit Priority Areas (including North Park north of Upas) (p. 38.)
2018 CAP Annual Report: https://www.sandiego.gov/sites/default/files/city_of_san_diego_2018_cap_annual_report.pdf
No change in bicycle mode share in Transit Priority Areas, still at 2 percent.
October 2016: North Park Community Plan Mobility Element: https://www.sandiego.gov/sites/default/files/3_mobility_np_november_0.pdf
Sets goal that “walking, bicycling, and transit should not be modes of last resort; rather they should be convenient, pleasant, safe, and desirable modes of travel.” Notes that “the community’s complete streets strategy would focus improvements within the existing rights-of-way, with an emphasis on walking, bicycling, and transit.” (p. 34.)
Recognizes that “the development of a well-connected bicycle network with protected bicycle ways where feasible will help to meet the community’s mobility vision.” (p. 39.)
Policy ME-1.16: Increase bicycle comfort and accessibility for all levels of bicycle riders with improvements such as . . . wider bike lanes and, where feasible, separated bicycle facilities.” (p. 41.)
Policy ME-1.17: Repurpose right-of-way to provide and support a continuous network of safe, convenient, and attractive bicycle facilities, where feasible.” (p. 41.)
Policy ME-3.1: Implement road diets (reduction in number of traffic lanes) or lane diets (narrowing traffic lanes) where appropriate to accommodate transit and bicycles within the existing street right-of-way. (p. 47.)
Policy ME-3.2: Provide a Complete Streets network that accommodates multiple modes of transportation throughout the community to accommodate all users of the roadway. (p. 47.)
Policy ME-3.3: Direct future transportation trips to walking, bicycling, and transit modes by creating a safe, effective multi-modal network. (p. 47.)
Policy ME-3.6: Repurpose right-of-way to provide high-quality bicycle, pedestrian, and transit facilities while maintaining vehicular access. (p. 47.)
Concerns about North Park Community Plan’s Bicycle Design:
KPBS Story on Program EIR: https://www.kpbs.org/news/2016/jun/30/north-park-test-san-diego-climate-action-plan/
Planning Committee chair notes that widening roads and removing bike lanes is “exactly the opposite of everything in our community plan . . . . We are doing nothing but asking for bicycle facilities. I mean, the idea is to get people out of cars.”
KPBS Story on Community Plan CAP Analysis: https://www.kpbs.org/news/2016/sep/20/san-diego-shortcomings-climate-action-plan-transit/
Notes that planning staff said community plan does not account for other policies, including “additional bicycle and pedestrian improvements whenever street resurfacing occurs, as feasible.”
Results in new Policy in Community Plan: “Support implementation of the CAP through the additional actions: Additional bicycle and pedestrian improvements whenever street resurfacing occurs, as feasible” and “prioritizing for implementation the highest priority bicycle and pedestrian improvements that align with “Vision Zero.” (SE-2.6) <https://www.sandiego.gov/sites/default/files/8_sustainability_and_conservation_np_november_1.pdf>
KPBS Story on City Council vote: https://www.kpbs.org/news/2016/oct/25/north-park-community-plan-update-san-diego-council/
Todd Gloria asks staff to “monitor North Park’s shift in commuting habits and to develop a mechanism that would trigger a review of the community plan if it proves insufficient at encouraging biking, walking, and public transit.”
Strategic Implementation Plan for the Bicycle Master Plan (approved by City Council on ): https://onbase.sandiego.gov/OnBaseAgendaOnline/Documents/ViewDocument/EXHIBIT%201%20-%20Strategic%20Implementation%20Plan.docx.pdf?meetingId=1210&documentType=Agenda&itemId=26177&publishId=106225&isSection=false
Task “c”: Leverage coordination of street resurfacing to take advantage of opportunities for progressive design standards to facilitate safer mobility, including . . . protect bikeways.
Task “f”: Capitalize on proposed projects that were not in the Bicycle Master Plan but have quickly risen to the forefront and provide the opportunity to show large mode share shifts in the short term.
Vision Zero:
March 2017: New San Diego Streets Design Manual: https://www.sandiego.gov/sites/default/files/street_design_manual_march_2017-final.pdf
1.8.2: Bikeways . . . should be continuous, leading to all major activity centers. . . . Consideration for alternative treatments consistent with the NACTO Urban Bikeway Design Guide and the City of San Diego Bicycle Facility Design Guidelines (note: never finalized) will be made on a case-by-case basis in order to promote safer and more attractive bikeway facilities.
II. 30th Street Protected Bike Lanes History Overview: The idea to add a cycle track, or protected bike way, to 30th Street was discussed as far back as 2013 at the request of local businesses. The 30th Street Cycle track has been in the City’s Capital Improvement Program priority list since 2013. More recently, during the Pipeline Replacement Project, the North Park Community Planning Committee began discussing additional bicycle lanes in September 2018. The City’s Bicycle Advisory Board discussed the idea in November 2018. Following the recommendations of North Park Main Street and the North Park Planning Committee, the Mayor directed staff to prepare a final design with protected bikeways and “remove parking where feasible while taking into account the needs of businesses and those with disabilities.”
September 2013: North Park Main Street votes to recommend the “30th Street Cycle track be added to the North Park CIP List. Passes unanimously: https://northparkmainstreet.com/wp-content/uploads/2018/03/Minutes-Board-2013.9.11.pdf
October 2013: Minutes from Public Facilities Subcommittee notes 30th Street cycle track presented to board: https://www.sandiego.gov/sites/default/files/legacy/planning/community/profiles/greaternorthpark/pdf/agendas/2013/13octagendanpsub1.pdf
Cycle track added to 2013 CIP List (p. 32.): https://www.sandiego.gov/sites/default/files/legacy/planning/community/pdf/cpc/agendas/attachments/master.pdf
September 12, 2018: North Park Planning Committee Public Facilities and Transportation Subcommittee: http://www.northparkplanning.org/wp-content/uploads/2018/PFT-DRAFT-Minutes-091218.pdf
Discussion on 30th Street Pipeline Replacement Project: “Will repaving include bike lane striping? There is outreach to Chris Ward’s office and plan is to try to get upgraded bike ways through the City. NPPC should weigh in to help with efforts.”
November 7, 2018: Discussion of “30th St. Separated Bikeway Proposal” by San Diego Bicycle Advisory Board: https://www.sandiego.gov/sites/default/files/bab_agenda_2018-11-07.pdf
Outreach from Chris Ward’s office began in March. Tyler Renner went door to door to businesses, posted flyers on doors, attended meetings (slide from presentation to NPPC):
North Park Main Street Final Vote: May 9, 2019 (third meeting on topic): Segment 1, Option B; Segment 2, Option A. Seg<https://northparkmainstreet.com/wp-content/uploads/2019/05/MAY-9-BOARD-PACKET.pdf>
North Park Planning Committee Final Vote: May 14, 2019 (third meeting on topic): Option A, both sections. (failed motion supported Option A on Segment 2, Option B Segment 1. No board members in favor of no bike lanes, Option B for Segment 2, or Option C for Segment 1.)
Mayor’s Memo: May 16, 2019: https://drive.google.com/file/d/0B774rwzAAx_-RjZTN2ktMGdteEhkSW9oOUR1UkxSc1pIR0w0/view
Directing staff to design protected bikeways from Howard to Juniper that “shall remove parking where feasible while taking into account the needs of businesses and those with disabilities. I am also directing staff to evaluate additional blocks north of Howard to Adams Avenue for protected bikeways and to include them in the final design.”

III. Why Protected Bike Ways Rather than Existing Sharrows or Route on Utah Street Overview: Under the progressive design standards currently followed by the City of San Diego and required by the Community Plan’s Complete Street’s policy, the speed of cars on 30th Street (speed limit 25-35mph) and traffic volume (~13,000 ADT) dictate that sharrows are not appropriate and protected bike ways are preferred for an “all ages and abilities” design. Recent survey data suggests the most important barrier to increased cycling is the lack of safe, protected bike ways.
Traffic Volumes <https://www.sandag.org/resources/demographics_and_other_data/transportation/adtv/sandiego_adt.pdf>
30th and University: 13,000 ADT
30th and Redwood: 9,500 ADT
City Recognized Bikeway Design Guidelines, Street Design Manual <https://www.sandiego.gov/sites/default/files/street_design_manual_march_2017-final.pdf>
No specific bikeway design guidelines currently complete, refers to FHWA Separated Bike Lane Planning & Design Guide and NACTO Urban Bikeway Design Guide (p 1-1.)
NACTO Urban Bikeway Design Guide <https://nacto.org/publication/urban-bikeway-design-guide/>
Doesn’t use sharrows (Class III) classification, refers to bicycle boulevard as street with sharrows markings, no dedicated bike lanes. Recommends only for streets with speed limit under 25 mph, 20 mph preferred, and 3,000 cars per day. <https://nacto.org/publication/urban-bikeway-design-guide/bicycle-boulevards/route-planning/>
NACTO Guide to Choosing an All Ages and Abilities Bicycle Facility <https://nacto.org/publication/urban-bikeway-design-guide/designing-ages-abilities-new/choosing-ages-abilities-bicycle-facility/>
Recommends protected bicycle lanes on any street with frequent buses, high curbside activity, motor vehicle congestion, or turning conflicts. Also recommends protected bike lanes on any street with motor vehicle speed (95th percentile, not 85th percentile speed limit) greater than or equal to 25 mph and traffic volume over 6,000 cars per day. All present on 30th Street
FHWA Bikeway Selection Guide, published February 2019: https://safety.fhwa.dot.gov/ped_bike/tools_solve/docs/fhwasa18077.pdf
Selection Matrix: Shared Lane on streets with speed under 25 mph and traffic volume under 3,000 cars per day. Protected (separated) bike lane on streets with volume over 7,000 cars per day or speeds over 30 mph (operating speed, not posted speed).
Parallel Routes on low volume side streets? (p. 34.)
To be viable, “street crossings should provide a similar level of service as the primary route.”
Alternative route is viable only if increase in trip length is less than 30 percent.
Example: 30th and University to 30th and Upas:
On 30th Street: 2,646 feet
On Utah Street: 4,337 feet: 64 percent increase in trip length
SANDAG 2018 Commute Behavior Survey. <https://www.sandag.org/uploads/publicationid/publicationid_4549_24879.PDF>
55.8 percent of current car commuters would use an alternative method of commuting at least once per week under the right circumstances. (p. 47.)
7.4 percent of current drivers chose cycling as the preferred alternative mode of commuting. Of those, 73.5 percent said they would commute by bike at least one day a week under the right circumstances. (pp. 43, 48.)
What are the right circumstances? 68 percent said they would be much more likely, 88.4 said much more or somewhat likely to commute by bike in “there were dedicated bike lanes for most of your route to work.” (p. 54.)
Safety: New Study shows protected bike lanes increase safety for people on bikes and people in cars, while sharrows are more dangerous than no bike lanes at all: https://www.citylab.com/transportation/2019/06/protected-bike-lanes-safe-street-design-bicycle-road-safety/590722/
IV. Will Bike Lanes Lead to Increased Ridership?
See SANDAG survey above: main barrier to more bike commuting in San Diego is lack of safe, dedicated bike ways as expressed by actual residents.
Vancouver: Adding protected bike ways designed for all ages and abilities led to bike commute share increase from 6.6% to 11.9% in five years: https://www.fastcompany.com/90361034/if-only-experienced-cyclists-feel-safe-in-a-bike-lane-then-is-it-a-bike-lane-at-all?partner=rss&utm_source=rss&utm_medium=feed&utm_campaign=rss+fastcompany&utm_content=rss?cid=search
Recent Examples in Seattle and Toronto: Increase in ridership of 400 and 300 percent, respectively: https://usa.streetsblog.org/2019/04/18/ridership-jumped-400-when-seattle-built-a-protected-bike-lane/
Study: Protected Bike Ways increase ridership between 21-171 percent: https://www.bdcnetwork.com/new-study-shows-protected-bike-lanes-increase-ridership-desirability-neighborhood
V. Will Bike Lanes Hurt Business? Overview: multiple studies from a variety of cities across the world demonstrate that bicycle lanes benefit businesses or, at the very least, have a neutral impact. People on bikes tend to visit local businesses more, spend more on average than drivers.
People for Bikes: Protected Bike Way Statistics: http://peopleforbikes.org/our-work/statistics/statistics-category/?cat=protected-bike-lane-statistics
CityLab: The Complete Business Case for Converting Street Parking Into Bike Lanes: https://www.citylab.com/solutions/2015/03/the-complete-business-case-for-converting-street-parking-into-bike-lanes/387595/
Strong Towns: How Bike Lanes Benefit Business: https://www.strongtowns.org/journal/2018/5/31/how-bike-lanes-benefit-businesses
Fast Company: Bike Lanes Aren’t Just Safer for Cyclists. They’re Good for Business, Too: https://www.fastcompany.com/3024974/bikes-lanes-arent-just-safer-for-cyclists-theyre-good-for-business-too
Forbes: Cyclists Spend 40% More in London’s Shops Than Motorists: https://www.forbes.com/sites/carltonreid/2018/11/16/cyclists-spend-40-more-in-londons-shops-than-motorists/#51d90923641e
VI. 30th Street Context: North Park is a young community with a large number of children. Many customers visiting the North Park Business District arrive by means other than driving and parking, young people are disproportionate share of customer base.
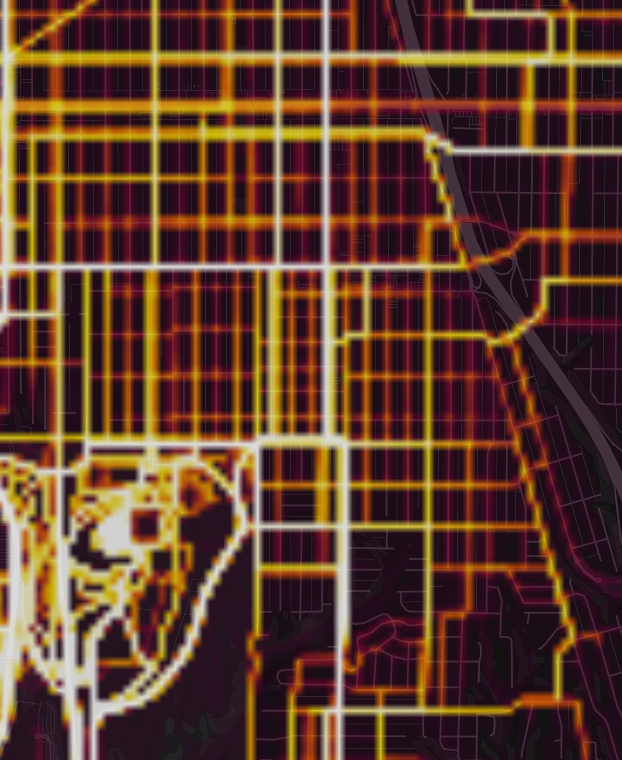
Current Bike Share: 2-3% of vehicle. Given 13,000 cars per day, average of 200-300 people on bikes per day. https://sandiego.maps.arcgis.com/apps/webappviewer/index.html?id=bfc87dd2eb8d4759b9694dbb5efa173f
Strava “Heat Map,” app showing where people ride bikes, presented by Everett at NPPC Meeting: https://www.strava.com/heatmap#14.77/-117.12885/32.73679/hot/all
North Park Demographics: SANDAG Demographic and Socioeconomic Estimates based on United States Census: http://datasurfer.sandag.org/download/sandag_estimate_2018_cpa_greater-north-park.pdf
Median Age: 39.2, more children under the age of 18 than people over the age of 65 (13 percent of population).
How Do People Get to 30th Street? NPMS 2017 Community Survey: https://northparkmainstreet.com/wp-content/uploads/2018/03/COMMUNITY-SURVEY-RESULTS-NEW.pdf
Only 40 percent of customers drove alone to North Park, 43 percent used alternative mode of transit that does not require parking, 5 percent rode bike.
80 percent under the age of 40. Only 4 percent over the age of 60 (less than 13 percent general population share)
Current Parking in 30th Street Area Between Upas and Howard: https://www.google.com/maps/d/viewer?mid=1mqPALwCY2kqAMzWcVBwI-ZyVapRPQOsT&ll=32.74755901273289%2C-117.12923595000001&z=16
258 parking spots on 30th Street itself
512 off-street dedicated business parking spots
625 paid parking spots (parking garage and surface lots)
402 parking spots on immediate east-west side streets (including identified angled conversions)
545 parking spots within one block on adjacent north-south streets
Total: 2,342 parking spots. Option A leaves 89 percent of parking within one block, 86 percent if dedicated business parking lots are ignored.